
researchED: Research leads network day, Brighton. April 18th 2015
The beginning of the new term means it’s taken a little while to get around to blogging about the great event on Saturday. This tardiness is additionally poor given that I was one of the presenters! However, there are some great summaries of the network day already out there. Two that caught my eye were:
ResearchED Brighton: inside out not bottom up via @joeybagstock
#rEDBright – summary of a research lead conference by a faux research lead! via @nikable
One of the themes that emerged from the day, for me, was the growing dissatisfaction with unreliable summative judgements of teacher quality and the view that schools would be better off looking at ways of formatively evaluating teaching through some sort of disciplined inquiry process.
From judgements of teaching quality …
Daniel Muijs opened the day with the provocative question ‘Can we (reliably) measure teacher effectiveness?’ His answer, which drew upon evidence from the MET project, suggested that that we could, though each of the tools for measuring teacher effectiveness had strengths and limitations. He analysed the reliability of VA data, observations and student surveys in turn.
Muijs suggested that the focus on student outcomes had liberated teachers to experiment more with their teaching – which is true, but it’s clear that a naïve treatment of this data has created problems of its own. For example, this focus on outcomes presupposes that there is a straightforward relationship between ‘teacher input’ and ‘student output’ (something Jack Marwood takes issue with here). Indeed, Muijs quoted Chapman et al (in press) saying that teaching probably only accounts for around 30% of the variance in such outcome measures.
In summative data of teacher performance, the inherent uncertainty within the measurement is expressed in the form of confidence intervals. A range of teacher VAM scores might look like this:

The vertical bars represent the confidence interval associated with each teacher’s score.
In essence they suggest that we can only have reasonable certainty that a teacher’s score lies somewhere between the top and bottom of each line. The marginal differences between the midpoints along these lines are not a reliable comparison (even though intuitively they may appear so). In the example above it is reasonable to say that teacher B produced higher value-added scores than Teacher A, but the overlap in the confidence intervals for teacher C and D means that we cannot readily distinguish between them.
However, this uncertainty can get ignored when teachers are ‘held to account’. Their use has led to some pretty egregious practice in the US, e.g. ranking teachers by their VAM scores in a kind of ‘league-table’ of teachers. In one instance the LA Times appeared to completely ignore the presence of confidence intervals and published the data like this:

Implying that the estimate of teaching quality was somehow a perfectly precise point rather than a range and creating spurious comparisons between teachers.
It struck me that schools in the UK risk falling into the same trap. For example when interpreting the sorts of VA graphs UK teachers might be familiar with:
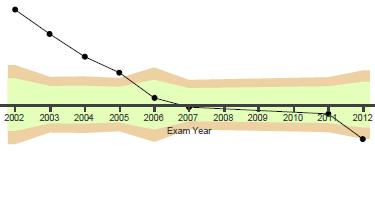
In the graph above, we can reasonably say that value-added was higher in 2005 than in 2012 (for what that’s worth), but can we readily distinguish between the scores for 2006 and 2011 on the graph above? The presence of a ‘dot’ above or below a mid-line may encourage the same sort of simplistic judgement as the LA Times: tiny variations in scores being interpreted as indicating something about teacher quality.
Indeed, even where a statistically significant deviation in VA scores is found, it doesn’t necessarily tell us whether the result is educationally important. Jack Marwood identifies this problem with the statistics used within RAISEonline to make judgements about schools:
“The explanations of significance testing in RAISE are misleading and often completely wrong. In the current version of RAISE, readers are told that, “In RAISEonline, green and blue shading are used to demonstrate a statistically significant difference between the school data for a particular group and national data for the same group. This does not necessarily correlate with being educationally significant. The performance of specific groups should always be compared with the performance of all pupils nationally.”
“The key phrase used to say, “Inspectors and schools need to be aware that this does not necessarily correlate with being educationally significant.” But even this does not make it clear how different statistical significance is to everyday significance. Everyday significance roughly translates as ‘important’. Statistical significance does not mean ‘importance’.”
The worst influence of this focus on the summative judgement of ‘teacher quality’ is that policy discussion falls into the ‘McNamara Fallacy’ – as described brilliantly in a recent blog by Carl Hendrick:
“… there is a deeply hubristic arrogance in the reduction of complex human processes to statistics, an aberration which led the sociologist Daniel Yankelovitch coining the term the “McNamara fallacy”:
“1. Measure whatever can be easily measured.
2. Disregard that which cannot be measured easily.
3. Presume that which cannot be measured easily is not important.
4. Presume that which cannot be measured easily does not exist.
“Sadly, some of these tenets will be recognisable to many of us in education – certainly the first two are consistent with many aspects of standardised testing, inspections and graded lesson observations. This fiscal approach been allowed to embed itself in education with the justification given often to ‘use data to drive up standards.’ What we should be doing is using “standards to drive up data””
The problem of using data to drive up standards was further highlighted in Rebecca Allen’s presentation. Drawing on her work with Education Datalab, she presented the problem of judging schools or teachers using the concept of expected progress.
I’ve written about this report before, but it’s worth reiterating the major points raised by their analysis.
 “Trajectory”
 “Reality”
From KS1 only about 9% of children take the expected ‘trajectory’ to KS4 outcomes and the assumption of linear progress becomes progressively weaker as you move from primary to secondary schools.
““Our evidence suggests that the assumptions of many pupil tracking systems and Ofsted inspectors are probably incorrect. The vast majority of pupils do not make linear progress between each Key Stage, let alone across all Key Stages. This means that identifying pupils as “on track” or “off target” based on assumptions of linear progress over multiple years is likely to be wrong.
“This is important because the way we track pupils and set targets for them:
“• influences teaching and learning practice in the classroom;
• affects the curriculum that pupils are exposed to;
• contributes to headteacher judgements of teacher performance;
• is used to judge whether schools are performing well or not.”
Allen suggested that we shouldn’t give students an attainment target grade to reach, but a range – to reflect the inherent uncertainty in predicting a student’s ‘expected progress’.
So, given all the problems with reliability, why are we trying to measure effective teaching? One answer is so that schools can identify and sack incompetent teachers, and presumably reward effective teachers through PRP. However, I’ve argued that the lack of reliability in the measures that exist risks perpetuating a ‘cargo cult’ approach to school improvement.
It may be possible, through a rigorous application of some sort of combination of aggregated value-added scores, highly systematised observation protocols (Muijs suggested we’d need around 6-12 a year) and carefully sampled student surveys to give this summative judgement the degree of reliability it would need to be fair rather than arbitrary. Surely the problem is that for summative measures of effective teaching to achieve that rigour and reliability they would become so time-consuming and expensive that the opportunity costs would far outweigh any benefits.
Therefore, it seems to me that these summative measures are unlikely to result in significant improvements to schools. It’s a cliché for politicians to announce that ‘the quality of an education system cannot exceed the quality of its teachers’. One retort to this might be:
‘Useful judgements of teacher quality cannot exceed the reliability of the data’
The stakes attached to statistical analysis of school or teacher data need to be moderated in line with the reliability of that data.
… to developing teaching through ‘disciplined inquiry’.
After coffee, the network day turned away from the issues of evaluation and assessment towards exploring ways in which teachers could use research evidence within, what Dylan Wiliam has called, ‘disciplined inquiry’.
Andy Tharby led a thought-provoking session discussing the work that Durrington High School have been doing with Dr Brian Marsh at the University of Brighton. He made the point that inquiry projects were nothing new within the school, but that previous versions of teacher-led projects had been overly reliant upon reflection as the sole source of evaluation. Through the partnership with Dr Marsh, they have developed more evidence-informed CPD opportunities (like an Edu Book club), started to disseminate blogs and bulletins through teachers’ pigeonholes and three teachers had taken on year-long projects aligned with the school’s improvement plan.
There’s no doubt that these partnerships between schools and HEI’s can provide mutual benefits, but as Tharby was quick to point out, the sort of informal relationships that can be struck up between individual schools and university based academics isn’t really scalable in a way that could transform schools.
Given the difficulty in accessing the evidence base and the problems for teachers trying to sort myths and neuro-nonsense from useful insights into learning, Lia Commissar presented an interesting resource that could be developed for teachers.
The trial, involving psychologists and neuroscientists answering questions from classroom teachers, runs until the 9th May.
James Mannion presented another resource which teachers might wish to explore. Praxis: a professional development platform, designed to help school-based practitioners develop their practice through small-scale research inquiry.
Again, the issue of moving practitioner-led research beyond reflection was suggested as a way in which teachers could regain ‘agency’ within their professional development. Mannion expressed his hope that Praxis could become a forum for teachers to collaborate in their efforts to optimise the outcomes for their students within their individual contexts.
He also proposed ‘Praxis’ as a new term to encapsulate all the various forms of teacher inquiry: lesson study, action research, disciplined inquiry, etc (though I’d prefer a less value-laded term, even if it appears ‘less exciting’). However, I dare say that teachers will continue to use the plethora of terms to describe essentially the same thing regardless of what anyone proposes!
Developing research tools for teacher inquiry
My session drew on the recent Sutton Trust report:
Developing Teachers: Improving professional development for teachers
You can download the presentation here: Research tools for teacher inquiry:
My argument was that the drive to find measures of effective teaching might be better focused upon developing reasonably valid ways for teachers to investigate their own teaching than pure accountability. I made the point that most of the measures developed for accountability purposes don’t necessarily provide very useful information for teachers trying to improve!
Observations: The value of these are often lost where schools use Ofsted style grading structures – which are principally summative. To improve teaching, we need focused and formative observation protocols to provide challenging yet supportive feedback.
Value-added data: This data, however reliable it may or may not be, appears too infrequently in the academic year to provide regular feedback on teaching. In general, the assessment data which teachers report to line managers and parents – whilst more frequently collected – isn’t often useful as a formative form of feedback. There’s also the problem that we may inadvertently distort the data we generate about students if there’s a target attached to it. What’s sometimes called Goodhart’s Law: “When a measure becomes a target, it ceases to be a good measure.” A better bet might be to encourage teachers to use question analysis to identify areas where their teaching or understanding of assessment could be developed.
Student surveys: These are potentially a cheap and easy source of reasonably valid feedback. However, even a good instrument can deliver poor data and surveys need strong protocols to provide effective feedback. I’ve written quite a lot about how the MET survey can be used as a formative tool within coaching here: Investigating teaching using a student survey
Reflection / self-report: Cognitive biases means pure reliance on ‘reflection’ is likely to have minimal impact on teaching practice. There likely needs to be an element of external challenge. However, I suggested using a behaviour log, based on Hayden’s research into behaviour in schools, as a self-report tool for teachers developing behaviour management or classroom climate. There’s more information about this here: Talking about the behaviour in our lessons
Work scrutiny: I made the point that techniques like content analysis, which might be used to gain insights into changes over time in books, are difficult and therefore tend to be conducted in a fairly superficial way (e.g. what colour pen the teacher is using). It may be possible, however, to create some simple protocols to look at specific features of students’ work to see whether they are responding to changes you’ve made in teaching.
Finally, I discussed the problems inherent in evaluating whether mentoring interventions were having the desired effect on student behaviour or effort in lessons.
Rob Coe’s ‘poor proxies for learning’ will likely be familiar to many who read this blog.
I added a few other proxies which I suspect may be unreliable when it comes to establishing whether a mentoring intervention is having the desired effect.
Discipline points: Problem is that a reduction may simply reflect the teacher ‘losing faith’ with the behaviour management system rather than improvements in behaviour.
Reward points: Where intrinsic motivation is lacking we instinctively employ extrinsic motivators. Where intrinsic motivation is ok, we shouldn’t (and usually don’t) use extrinsic motivators (which is why ‘naughty’ kids tend to get more reward points than ‘good’ kids).
Effort grades: Attitudes to learning scores may simply reflect teacher bias.
e.g. Rausch, Karing, Dörfler and Artelt (2013) Personality similarity between teachers and their students influences teacher judgement of student achievement.
Attitude surveys: Can be easily distorted by social desirability bias. There is also a big gap between a change in reported attitudes and actual changes in behaviour.
However, I ended by wondering whether there might be some behaviour that is ‘proximal enough’ that we could use simple structured observation techniques in lessons to evaluate changes in student behaviour. Drawing on the idea of a ‘time on task’ analysis, I asked the group to think about some behaviours which might indicate the presence or absence of ‘thinking hard’ in a lesson.
Measuring teaching: The need for a shift of focus
Developing simple research tools could help teachers move beyond ‘pure reflection’ as the basis of challenging their teaching practice and provide an empowering way for teachers to improve the quality of their own teaching.
However, it can be difficult to develop and validate these tools within the context of a single school and the initial time demands can be high. I commented that I had barely got started in piloting these with teachers (which created some very flattering spontaneous laughter from the audience), but even adapting the MET student survey to a formative purpose is a tricky task if you don’t want to lose whatever validity it possesses.
Nevertheless, I think it’s worth trying. It seems a plausible hypothesis that developing teacher inquiry tools which provide reasonably valid, developmental feedback could improve outcomes for students and foster greater professional autonomy for teachers.

Reblogged this on The Echo Chamber.
LikeLike
Pingback: Research tools for teacher inquiry | Evidence into practice
Many thanks for that really interesting overview. The reality in most schools must surely be that there is no consideration of research evidence and certainly no understanding of the pitfalls of data. Is there anything in the pipeline (or already published) that could be disseminated to schools, categorically showing what can not be read into data and why? It would need to be fairly brief without too many big words.
LikeLike
Reblogged this on Blogs of the Month.
LikeLike
Pingback: How do we know if a teacher’s any good? | David Didau: The Learning Spy
Pingback: On our language | MrHistoire
Pingback: The ‘artificial science’ of teaching: System vs Individual competence | Evidence into Practice